Using Venn Diagrams when Searching on HeinOnline

Statistics
Are you a visual learner? Then you might like this graphic feature on HeinOnline. You can get HeinOnline to display a Venn Diagram of your search in the Law Journal Library
HeinOnline’s Tip of the Week: How to Use a Venn Diagram Search explains how it works. You’ll see there’s an embedded YouTube video which you can stop and start to take you through the process and there are easy steps to follow on the blog post. The post takes you through a search on the Law Journal Library using the Advanced Search feature with the search string:
“child rights” AND “juvenile delinquency” AND “social work”
You may already be familiar with the double speech marks used for phrase searching and the AND which goes in block capitals which is part of what we refer to as Boolean searching from our Tips and Tricks for Advanced Searching guide.
The Venn Diagram can help you as it has a coloured intersection to show where all of your search terms come together to produce your results:
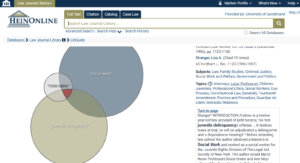
You can click Clear to explore other results from parts of your search string so you can view results from other combinations of the search string keywords you have used. Don’t forget you can find more help on using phrase searching and Boolean on your Canvas Programme home page in Improve Your Research Skills’ Finding and Using Books, eBooks and eJournal Articles area.